Thunkable Docs
Build an AppDrag and Drop DocsSnap to Place DocsAcademy
Drag and Drop
Drag and Drop
  • What is Thunkable?
  • 🗺️Getting Started
    • Gen AI
      • Prompt Engineering
      • AI tools
      • AI Chatbot Helper
      • AI Template Generator
    • Getting Started Guide
    • Keyboard Shortcuts
    • Undo Redo
    • Thunkable Account
      • Account Management
    • Preview and Test your App
    • Versioning
    • Data Sources
      • Google Sheets Data Source
      • Airtable Data Source
      • Webflow Data Source
      • Local Table Data Source
    • Project Collaboration
      • Organizations
    • 🎓Sample Apps & Tutorials
      • Thunkable Community Forums
      • Sample Apps
      • Video Tutorials
        • Thunkable Live App
          • How to Test and Troubleshoot with Thunkable Live App
        • Data Source Tutorials
          • Connecting to Data Sources
            • Google Sheets
            • Local Table
          • Create Data in a Thunkable Data Source
          • Read Data in a Thunkable Data Source
          • Update Data in a Thunkable Data Source
          • Delete Data in a Thunkable Data Source
        • User Auth & Management
          • Firebase
            • User Sign-Up, Sign-In, and Auth
            • User Sign Out and Password Reset
          • Google
            • User Sign-Up, Sign-In, Sign-Out, and Auth
          • Apple
            • User Sign-Up, Sign-In, Sign-Out, and Auth
        • Projects
          • How to Save Versions of Your Thunkable Project
          • How to Copy and Customize Public or Sample Thunkable Projects
        • User Interface & Design
          • Screens
            • Save and Reuse Thunkable Screens
            • Change Thunkable Screens with a Button Click
            • Create Scrollable Screens in Your Thunkable App
          • Navigators
            • How to Use the Thunkable Stack Navigator
            • How to Use Thunkable Top and Bottom Tab Navigators
            • How to Use the Thunkable Drawer Navigator
            • Combine Figma Frames with Thunkable Navigators
          • Components
            • How to Use the Visibility Property to Create Modals in Thunkable
          • Data Visualization
            • Customize a Data Viewer
          • Text
            • Implement Text Input Validation
        • Alerts & Notifications
          • Display Alert Messages in Your Thunkable App
          • How to Create Three-Button Alert Messages
        • Files
          • Cloudinary
            • Store and Access Cloudinary Files in Your Thunkable App
        • Camera
          • How to Use the Device’s Camera
          • How to Use the Device’s Video Camera
          • Use the Device’s Camera as a QR or Barcode Scanner
        • Realtime Databases
          • Firebase
            • How to Read Data in a Firebase Realtime Database
            • How to Update Data in a Firebase Realtime Database
        • Advanced Blocks
          • Connect Your Thunkable App to a Web API
        • Thunkable Academy
          • Building Your First Thunkable App
            • Getting Started with Thunkable
            • How to Design a Thunkable App
            • How to Connect a Thunkable App to a Data Source
            • How to Make A Thunkable App Interactive with Blocks
          • Thunkable No Code App Creation Basics
            • Thunkable UI Components and App Features
            • Understanding Thunkable's Drag and Drop Block Builder
            • Design, Develop, Debug, and Deploy Your App
        • Hour of Code
          • 2021 - Build an Informational App
          • 2022 - Build a Scavenger Hunt App
          • 2023 - Build a Translator and Text-to-Speech App
        • App Building
          • How to Build a Translation App in Thunkable
          • How to Create an Image Recognition App with Thunkable
          • How to Create a Text-to-Speech App in Thunkable
  • 🎨App Design
    • User Interface (UI) Components
      • Basic Components
        • Button Component
        • Label Component
        • Rich Text Component
        • Image Component
        • Text Input Component
        • Layout Component
        • Group Component
      • Data Components
        • Simple List Component
        • Data Viewer Components
          • Data Viewer List Component
          • Data Viewer Grid Component
          • Custom Data Viewer
      • Input Components
        • Switch Component
        • Slider Component
        • Checkbox Component
        • Date Input Component
        • Time Input Component
      • Media Components
        • Animation Component
        • Video Component
        • Loading Icon Component
      • Embed Components
        • Web Viewer Component
        • Map Component
        • Canvas Component
        • PDF Reader Component
        • Rating Component
      • Modules
        • Introduction
        • User Guide
      • Generative AI
    • Screens
      • Save and Reuse Screens
      • Improve Thunkable Load Time
    • Navigators
      • Top Tab Navigator
      • Bottom Tab Navigator
      • Drawer Navigator
      • Stack Navigator
    • Figma Integration
  • 🛠️Blocks
    • Thunkable Blocks Overview
    • Core Blocks
      • Control Blocks
      • Logic Blocks
      • Math Blocks
      • Text Blocks
      • Lists Blocks
      • Color Blocks
      • Device Blocks
      • Objects Blocks
      • Variables Overview
        • Connect a Firebase Realtime Database
        • Variables Blocks
      • Functions Blocks
    • App Features Blocks
      • Speech Blocks
      • Sound Blocks
      • Share Blocks
      • Camera Blocks
      • Files Blocks
      • Sign In Blocks
        • User Sign Up, Sign In, and Authentication with Firebase
        • User Sign Up, Sign In, and Authentication with Google
        • User Sign Up, Sign In, and Authentication with Apple
      • Location Blocks
      • Push Notification Blocks
      • In-App Purchase Blocks (with RevenueCat)
      • Data Sources Blocks
      • Alerts Blocks
      • Timer Blocks
      • Sensors Blocks
        • Gyroscope
        • Magnetometer
        • Accelerometer
        • Location Sensor
      • Ads by AdMob
    • Advanced Blocks
      • Web APIs Blocks
        • CORS Policy
        • 🆓No Auth APIs
          • Update Data in a Data Source
          • CRUD Operations
          • Setting Headers
        • 📊Charting APIs
          • Create a chart template
          • Charting in Thunkable
      • Bluetooth Low Energy Blocks
      • OpenAI Services ChatGPT Integration Blocks
      • "Any Component" Blocks
      • JavaScript Web Bridge
  • ⚙️Settings
    • App Settings
      • Tablet View
    • Assets
    • Cloud Variable Viewer
    • Manage your Projects
      • My Projects Page
      • Thunkable Projects
      • Duplicate Project
      • Share Your App
      • Download Your App
        • Download Your App on iOS
        • Download Your App on Android
      • Add to Home Screen
      • Managing Project Storage
      • App Data Privacy
      • Delete Project
  • 📱Publishing
    • Overview
    • Publish to the Apple App Store
      • User Guide
      • Troubleshooting
      • Review Process
      • Tracking Usage Description
    • Publish to Google Play Store
      • User Guide
      • Troubleshooting
      • Review Process
    • Publish as a Web App
      • User Guide
      • Custom Domains
      • Troubleshooting
    • Testing
      • Testing on iOS via TestFlight
      • Testing on Android
    • Troubleshooting
      • Publishing Checklist
      • Generate Screenshots
  • 🎮Gaming
    • Gaming Overview
      • Canvas Label
      • Sprites
      • Sprite Gallery
    • Gaming Blocks
      • Events
      • Motion
      • Looks
      • Direction
      • Sensing
      • Add & Remove
      • Stage
  • 🗃️Additional Resources
    • Release Notes
      • Release Notes 2025
      • Release Notes 2024
      • Release Notes 2023
    • Troubleshooting
      • Can't Sign in to Thunkable?
      • FAQs
    • Minimum Requirements
    • Bugs and Product Feedback
    • App Services and Emulators
Powered by GitBook
On this page
  • What are URL Parameters?
  • Create a chart template
  • Save the template

Was this helpful?

Export as PDF
  1. Blocks
  2. Advanced Blocks
  3. Web APIs Blocks
  4. Charting APIs

Create a chart template

PreviousCharting APIsNextCharting in Thunkable

Last updated 2 years ago

Was this helpful?

What are URL Parameters?

One of the quickest and easiest ways to send data to an API is by passing information, which we call parameters, in the API URL. One great use case for this is to create graphs and charts with data that has been generated in our app. QuickChart is a no-code solution to automatic chart generation. Create a chart template using the interface. Then use the template endpoint to customize and generate charts automatically.

In this guide, you will learn how to:

  1. Create and customize a chart template without any code.

  2. Save the chart as a URL (API endpoint) that you can use in emails, Excel, Salesforce, and any other formats.

  3. Set the chart’s data by providing special parameters in the URL.

Create a chart template

Add data

To get started, add some dummy or example data. The chart preview will update so you can get an idea of how your visualization will work.

Enter data as comma-separated values (e.g. 10,20,30,40). Each data value maps to a label (e.g. Jan, Feb, Mar, Apr). Edit “Labels” at the top of the Data settings to change this mapping.
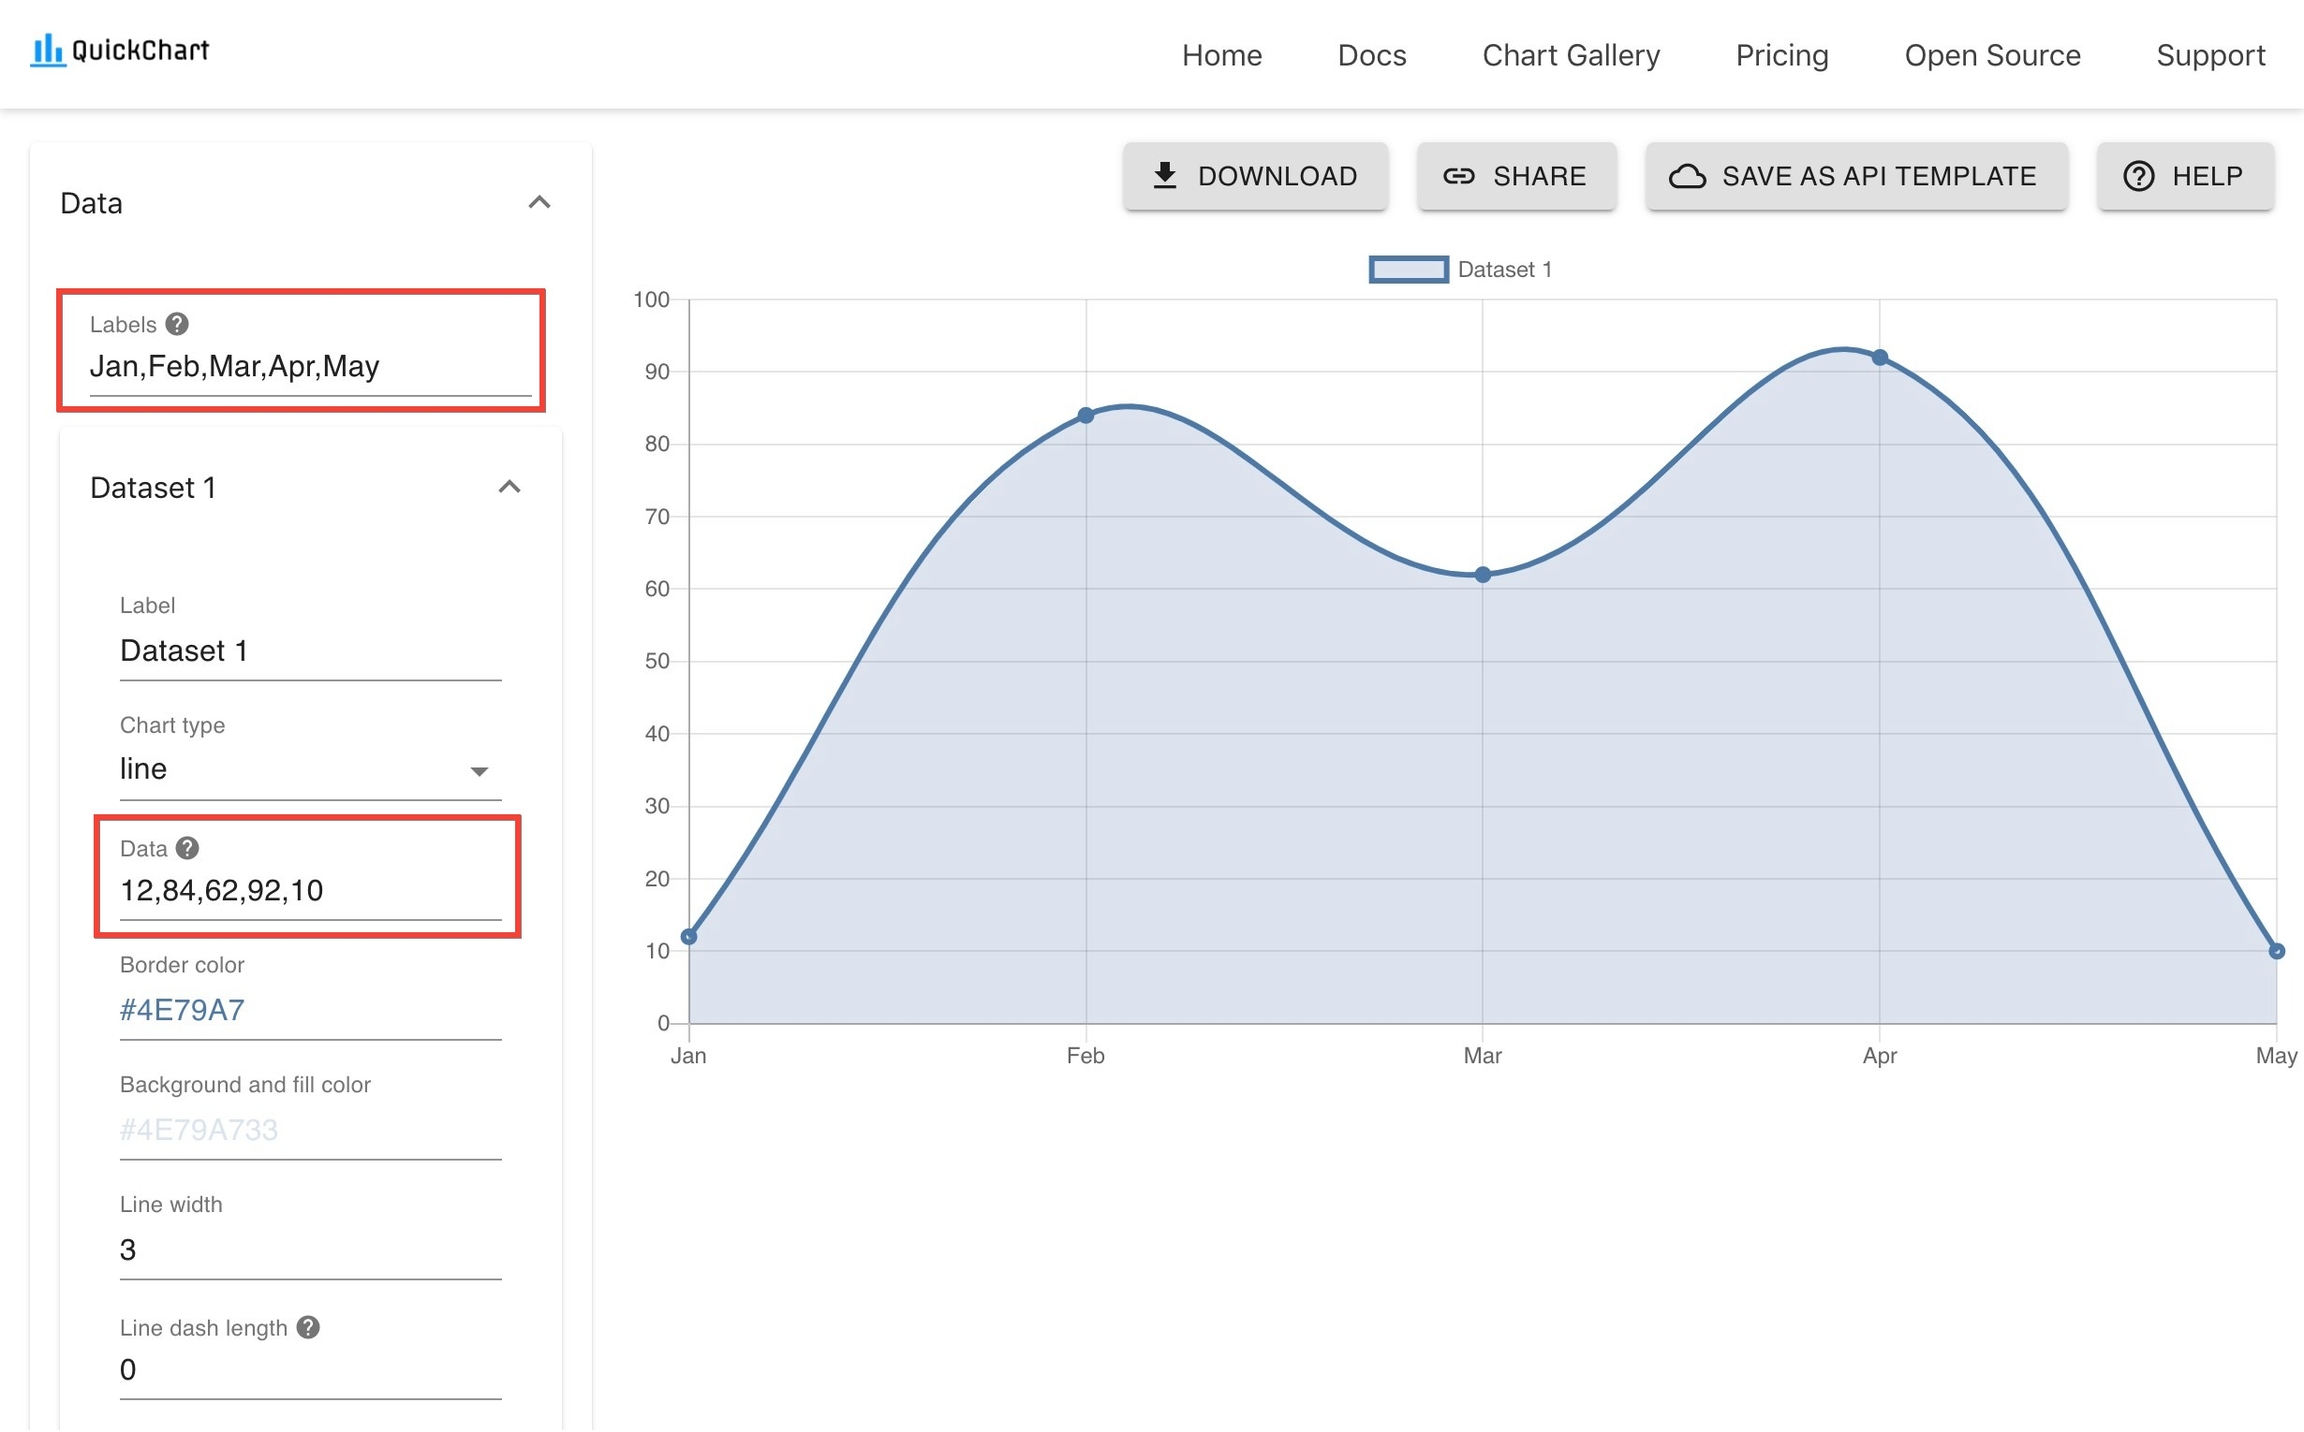
Edit labels and data on the left-hand side of the chart maker

Using coordinates

For more advanced use cases, you may provide your data as (x, y) coordinates.

An example of category-based coordinates: (Jan, 10), (Feb, 20), (Mar, 30), (Apr, 40). These coordinates will give you more power over how your line or scatter plot is displayed.

Numeric coordinates are also accepted: (1, 50), (10, 40), (12, 20), (8, 10). This format is most commonly used for scatter plots, and requires you to change your Axes to linear or logarithmic under settings. In this case, you should clear the “Labels” setting at the top of the Data settings - labels will be automatically generated.

Time series use coordinates too. For example: (2020-01-01, 50), (2020-03-15, 12), (2020-06-05, 40). To display time series, change the X-axis to time type and clear the “Labels” setting in Data settings, as labels will be generated automatically.

Customize look & feel

Now that your data is set, time to make the chart look however you want.

Close the data menu to customize your chart’s axes, ticks, legend, and its overall layout.
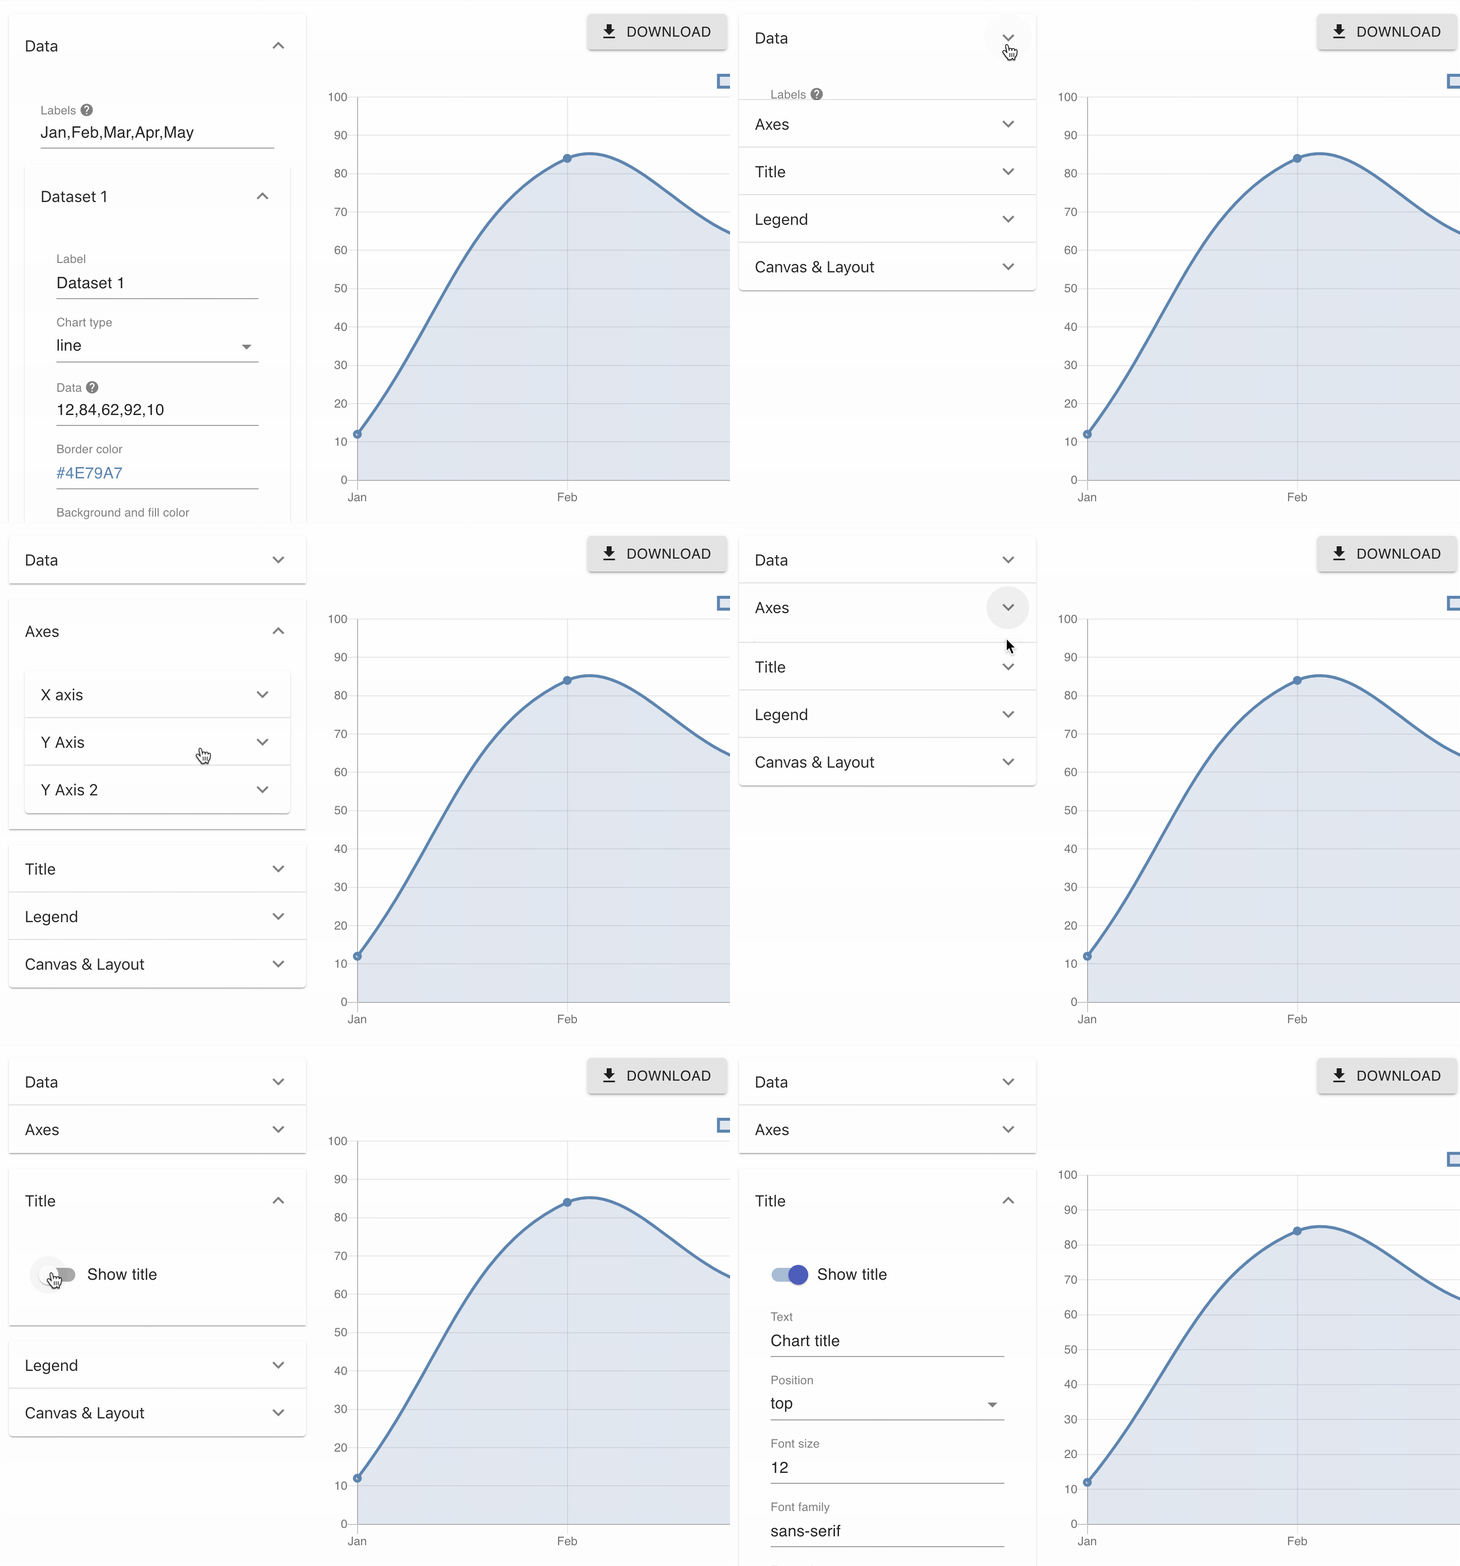
Customize the chart by expanding different sections

Save the template

Click Save as API Template in the top right.

You’ll be presented with an API endpoint. This is the base URL of your chart. If you go to it, you will see a chart image. The URL can be further customized to override properties of your chart.
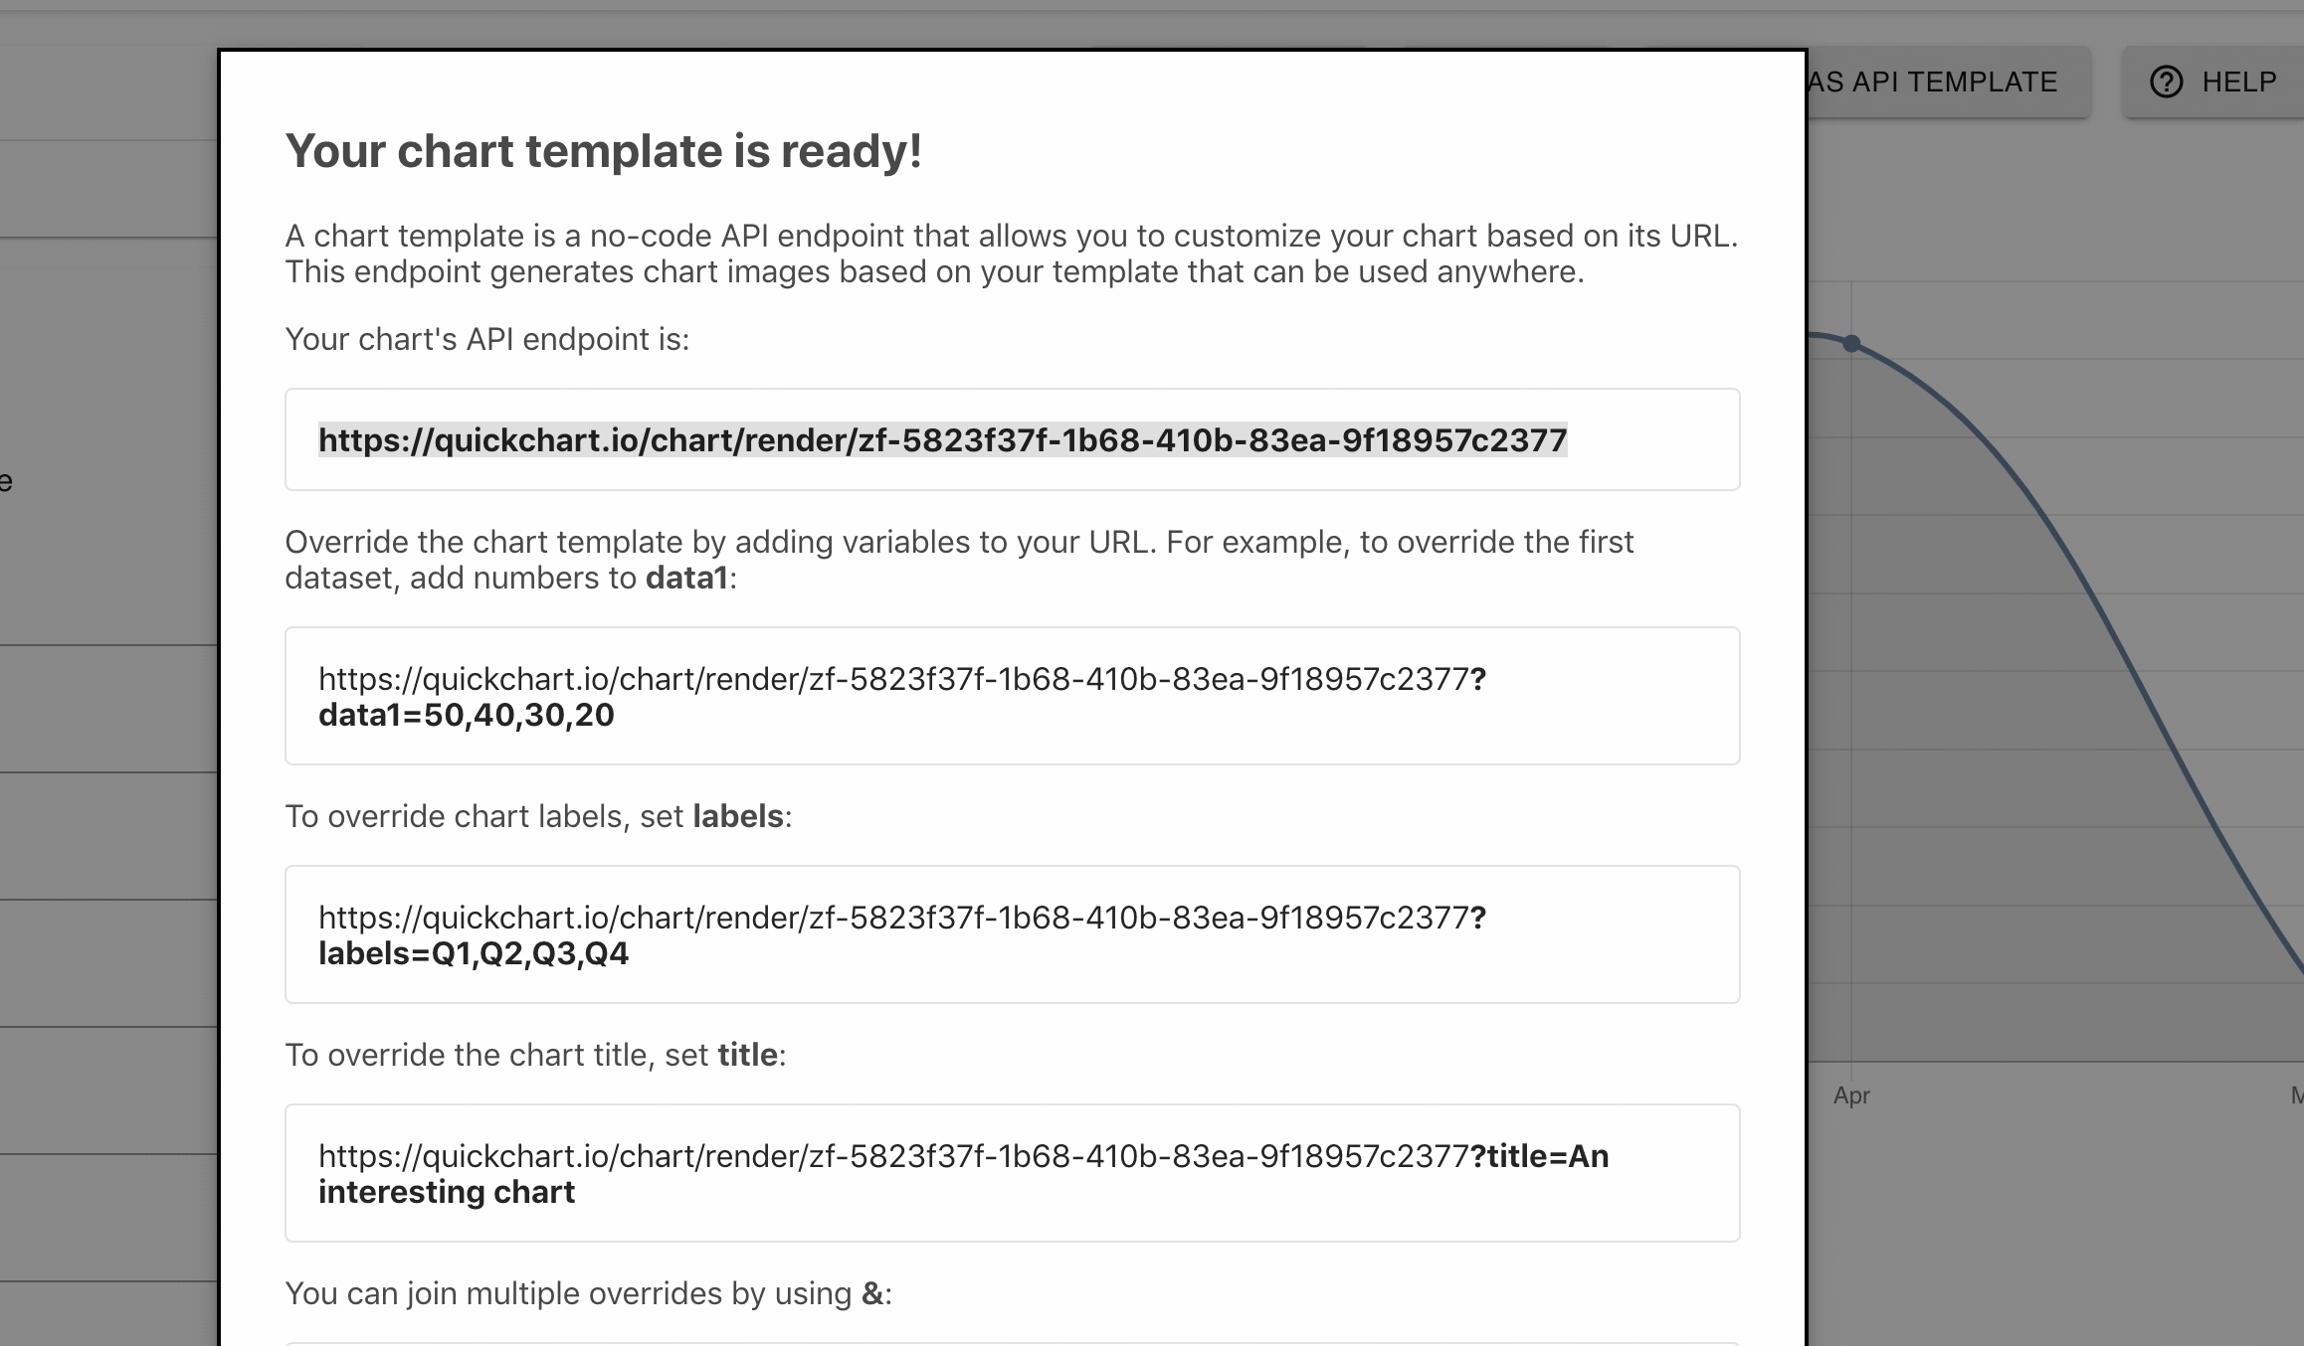
Saving as an API template gives you an endpoint you can use to generate unlimited charts.

To create charts online, first go to the . Use the interface to build a chart template. This chart will be the basis of the charts you generate automatically in the future.

Looking for inspiration? Head over to the - most examples are editable in the chart maker.

🛠️
📊
chart maker
chart gallery
chart maker